The PhD Metagame
How to Get Your Paper Accepted
Page 1 Accepts, the Rest Avoids Reject
In 2019, I submitted a paper that was rejected with review scores 2.5, 3, 3. One week later, I resubmitted it with minor changes, and it was accepted with scores 4, 4.5, 4.5.01 For context, that’s an almost unspeakably dramatic jump in scores, from “middling reject” to “strong accept.”
This post shows exactly those changes. We’ll frame them in two parts:
- Polish page 1 for acceptance
- Use the remaining pages to avoid rejection
Page 1 has four parts: title, abstract, Figure 1, and introduction. We’ll make them specific, memorable, clear, communicate value, and hook the reader. Reviewers mostly decide accept vs reject by page 1. So we optimize the judgment-before-scroll.
Then, to make sure our paper isn’t rejected, we’ll do due diligence in the rest of it by including stuff like baselines, ablations, statistical significance, and human evaluation.
The tweaks that get the paper accepted—unexpectedly, happily—also improve the actual science contribution. But if you’re tempted to be evil, read this footnote.02 The full rejected and accepted submissions are available for download at the end.
Page 1 Is 80% of Your Paper
A paper has five parts:
- Title
- Figure 1
- Abstract
- Introduction
- Rest of the paper
Spend equal time on each of these.
— Me misquoting03 Jitendra Malik quoting Don Geman
Around 80% of a paper’s perceived quality is established on page 1. The title, Figure 1, abstract, and half the introduction are all there. It’s like a book’s cover.
Throughout this post, I’ll show the rejected and accepted versions of the paper I mentioned at the top with the dramatic score swing. Here are both page 1s:

Top: Left: Rejected page 1. Bottom: Right: Accepted page 1.
First, consider page 1’s first impression:04
- Is the Figure 1 colorful and eye-catching?
- Is the title unexpected? Maybe it has one intriguing word?
- Are there any curious terms (bolded or italicized)?
- Is the introduction (hopefully not) full of citations?05
Choose A Specific Memorable Title
Rejected: Visually Grounded Comparative Language Generation — too general. Any work that uses pictures and generates comparisons could use this title. I picked this title because I thought it argued for the generality of the method. But a too-general title is off-putting because it comes across as over-claiming. And a big part of our method does rely on our domain: we specifically use a biological taxonomy to create our dataset.
Accepted: Neural Naturalist: Generating Fine-grained Image Comparisons — specific and memorable. In addition to branding (more next), naturalist establishes the domain, and fine-grained narrows the task. Skeptical academics appreciate the clarity of saying what you did. The title is fully unique to our work.06
Maybe Add Branding
I used to dislike branding in papers. It felt presumptuous to claim a proper noun for your research paper and to expect readers to memorize it. And many of the names sound corny.
Now, while I still often feel a pang of annoyance, it is outweighed by the recognition that it’s much easier to remember and discuss concepts which have a name. Neural naturalist or Birds-to-Words instead of “our 2019 EMNLP paper about generating comparative image captions…”
That said, I still dislike throwaway names—those with no conceptual link, or which don’t feel earned. I don’t think every paper needs one. But I think it helped for this paper.
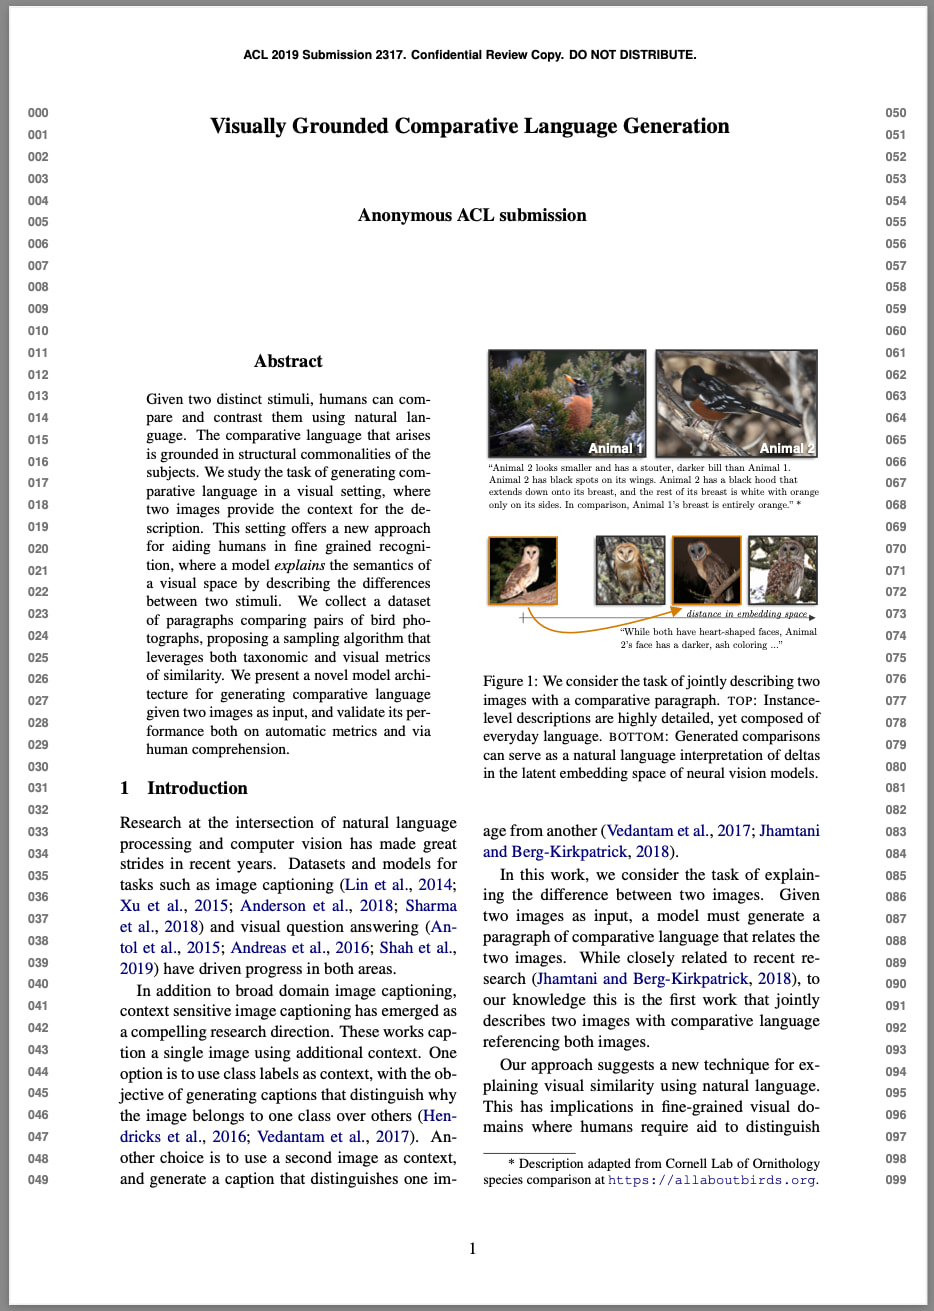
Show Screamingly Obvious Value in Figure 1
The main point is that your paper’s value should be obvious, not that is must be enormous.
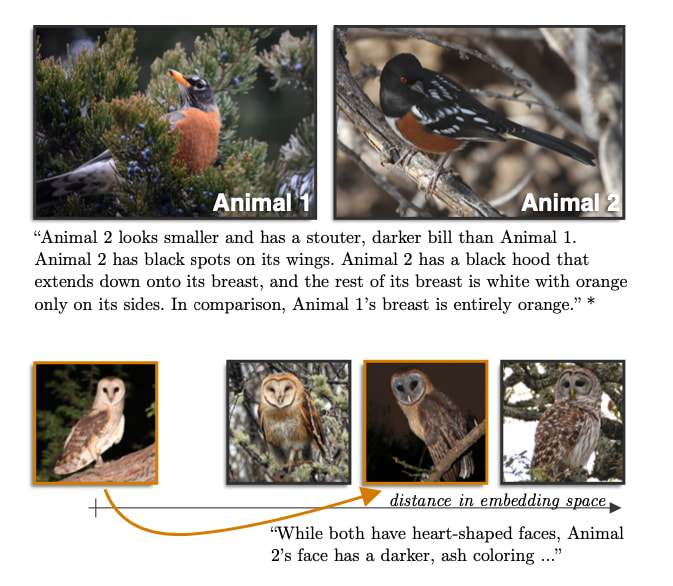
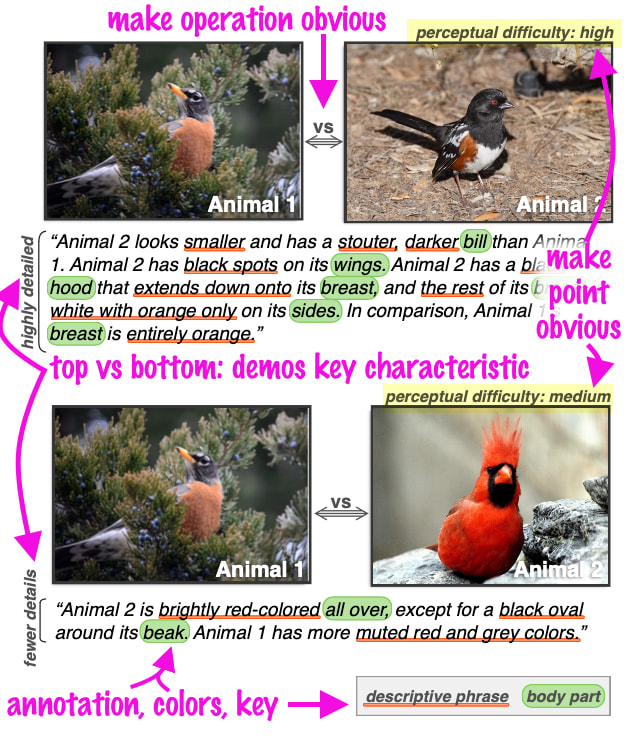
Top: Left: Rejected Figure 1. Bottom: Right: Accepted Figure 1.
A Figure 1 should
- draw readers in
- clearly demonstrate describe both what the work does and its value
- be comprehensible without the caption.
The old Figure 1 showed two separate comparisons, but the link between them wasn’t clear. The bottom row just all look like owls to a non-expert. And the descriptions are long and boring.
The new Figure 1 makes the works’ focus explicit by anchoring with the same left image, and labeling each comparison with a perceptual difficulty (“high” vs “medium”). It annotates the operation (“vs” = comparison) and the result (“highly detailed” vs “fewer details”). At this point, the paper’s mechanics and unique characteristic has been established: we use different language to compare things based on how similar they look. Finally, to make the long descriptions more approachable and interesting, we’ve highlighted two components (features and parts, with orange underlines and green bubbles).
A problem with making Figure 1s—and describing your research in general—is that you know so much about it, it’s impossible to mentally model what it’d be like to learn about your work for the first time. Spending time away from your work is extremely helpful here, if possible. I think I benefitted by having the conference review period (a month or two?) away from the paper, so I could come back to it with fresh eyes and rethink how best to illustrate it.
I’ve written about Figure 1s before. Even at the peak of my Figure 1 game, it was normal to make ten drafts before submitting.
End Each Caption with the Takeaway
I think this is the single best paper-writing hack I’ve ever learned.
This Figure 1 is so information-dense nearly the whole caption is the takeaway (yellow). Compare vs the old caption which, has side note (red) taking nearly 1/3 of the (extremely valuable front-page) real estate!
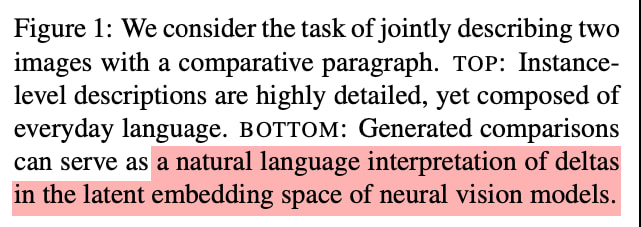
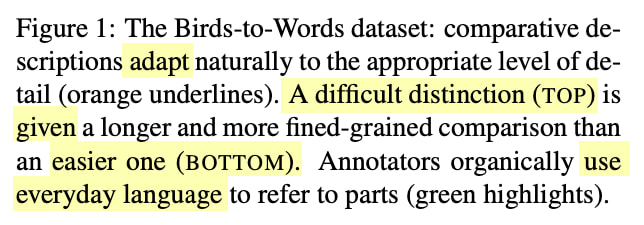
Top: Left: Rejected Fig 1 caption. Bottom: Right: Accepted Fig 1 caption.
A takeaway message explains not what is literally being shown in the figure (that comes first), but what you should think about it.
It might feel strange to do this in scientific writing, because it feels like it crosses the boundary from description into interpretation. But I urge you to do it, especially for less formal fields like computer science because:
-
You’re saving readers time trying to understand what point you are trying to make by just writing it out.07
-
With good captions, you can understand the whole paper by only looking at the figures. Many (most?) future readers will read your paper this way.
-
The scientific reader has a grain of salt mindset about everything you write anyway, so don’t stress about the ‘interpretation’ aspect.
If you aren’t trying to prove a point, well, perhaps reconsider that figure.
I got even more brazen about takeaways in future papers, even writing bolded “Takeaway:” in the caption itself.08
The Abstract: A Specific Valuable Hook
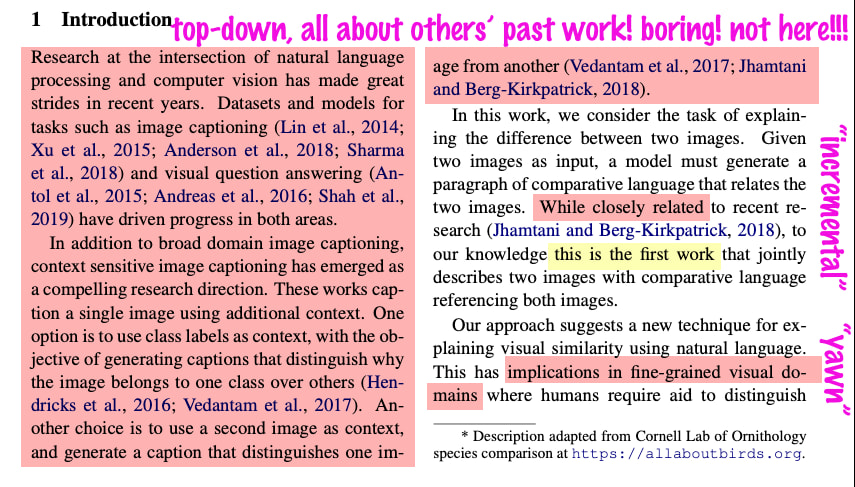
A classic mistake for a certain type of nerd (e.g., me) is to write top-down, going from general concepts to your specific topic. This is tempting because it feels orderly and taxonomic.
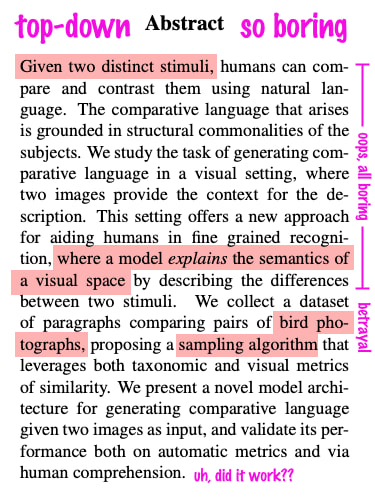
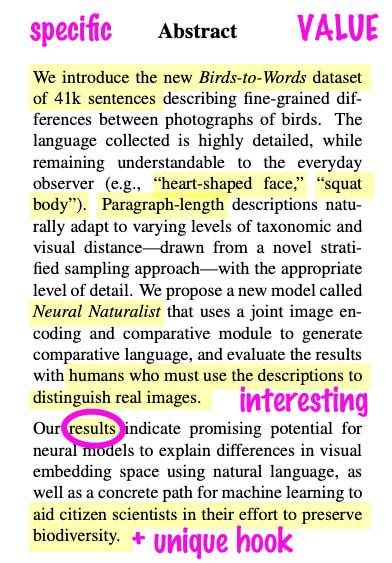
Top: Left: Rejected abstract. Bottom: Right: Accepted abstract.
But this turns out terribly, as you can see in the rejected abstract. It’s both boring and feels over-claiming. After top-down framing, and an aside, there’s a ‘betrayal’ of scope when we reveal our actual task.09
Everything is more specific in the revised abstract: what we study, our contributions (dataset and model), all the way to literal descriptions of specific birds and the task done in human evaluations. There’s a results teaser, and a hint of a unique hook. It’s not only more specific, it’s more fun and compelling to read.
You don’t think your reader wants to have fun and read something compelling? Try reviewing conference papers. Enjoyable writing is like water in a desert. Reviewers won’t even realize why they’re happy, the’ll just like the paper. Read YOLOv3 and tell me you don’t enjoy it.10
Use Tension/Release Cycles in the Intro
Can you believe we’re still on page 1? It’s that important.
Here we’re discussing specifically the portion of the introduction visible on page 1. We’re optimizing for what we could call judgment-before-scroll.
My original draft was so bad it’s easy to improve. But if I could write something this bad as a 4th year PhD student, others could too.
Top: Rejected page 1 intro. Bottom: Accepted page 1 intro.
My original introduction completely lacks any mention of a problem, and is devoid of tension. It begins with a top-down pile of related work, then side-swipes our own paper with negative implications.
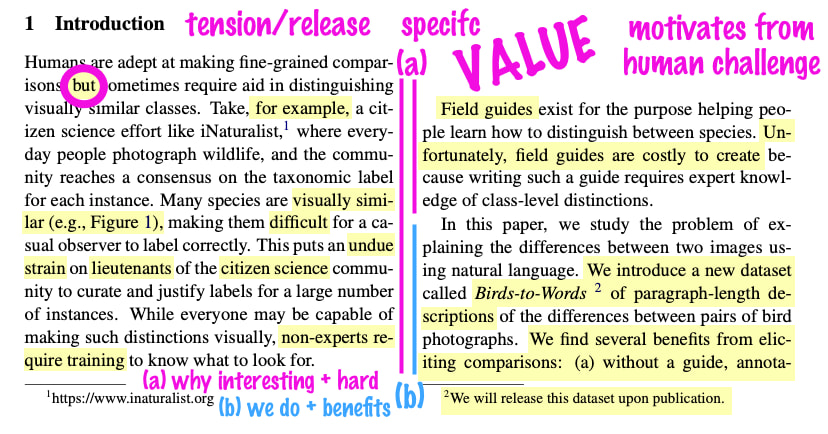
The revised introduction launches straightaway into the problem.
It uses tension/release cycles at multiple resolutions to build up the stakes of the problem and the perceived value of solving it. First, at the paragraph-scale: ¶ 1+2 builds up the problem (tension), ¶ 3 presents our solution (release). Then at sentence-scale, unstable language creates tension: “but,” “difficult,” “strain,” “while X, Y,” “unfortunately.”
On the backbone of these tension/release cycles, we spend the first two paragraphs setting up our task as being specific, difficult, valuable, and unique. And I really mean each of those adjectives. The final bit of visible text (on page 1) introduces a concrete contribution, our dataset.
I hesitate to recommend a video here because it’s both slightly abstract and eighty minutes long, but Larry McEnerney’s talk on Effective Writing is the single best material I’ve seen on thinking about your writing. I saw it way after grad school, but I wish I’d seen it during because I spent a lot of time blindly reverse engineering bits of it (on display in this essay). Some relevant key points:
- All of life before your job, people (teachers) have been paid to read your writing
- Now that they’re not, your writing must deliver value (which is often entertainment)
- High-value text poses problems with tension-filled language, articulating costs or benefits
I didn’t understand this framing (of problem, tension, value) while writing the revision. But in hindsight, it’s shockingly clear how faithfully the improved draft adheres to it.
Use the Rest of the Paper to Avoid All Reasons for Rejection
If we’ve done our job, reviewers have now finished reading page 1 and want to accept our paper. Our job now is to let them. How?
Surprise, I have another great two-step process. It uses thinking in reverse:
- Think of all the reasons a reviewer might reject your paper
- Avoid everything in 1.
The more obvious reasons for rejection have to do with completeness: “you didn’t compare against method X.” But those are often used as objective crutches to justify a gut decision based on lack of clarity. So we must ensure completeness and also polish up the clarity.
After page 1, the main changes I made are:
- improving all the figures and tables (clarity)
- adding baselines (completeness)
- adding ablations (completeness)
- rewriting the conclusion (clarity)
For reference, other common additions are:
- human evaluations (completeness)
- statistical significance (completeness)
The running text is nearly identical. This is great because someone skimming the paper—looking at only figures, tables, and the conclusion—can enjoy all the improvements.
Make Figures Dense and Beautiful
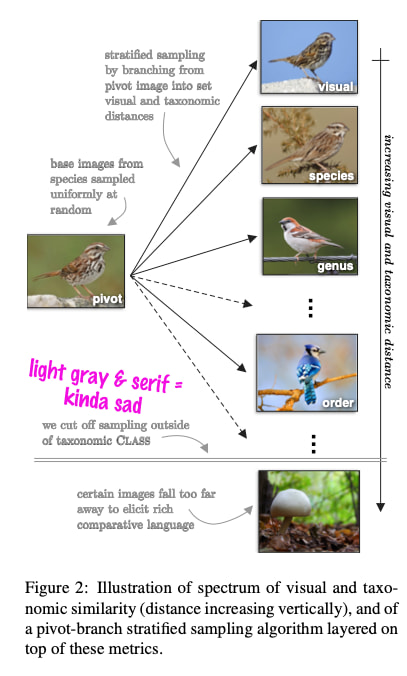
There’s this complicated part of the paper called pivot-branch sampling. I was very excited about it but nobody else cared about it. (I think not even my coauthors, though they were too kind to ever say so).
I had the decency to relegate most of pivot-branch sampling to the appendix, but it has to be mentioned a little bit in the body because it’s in a dataset paper.
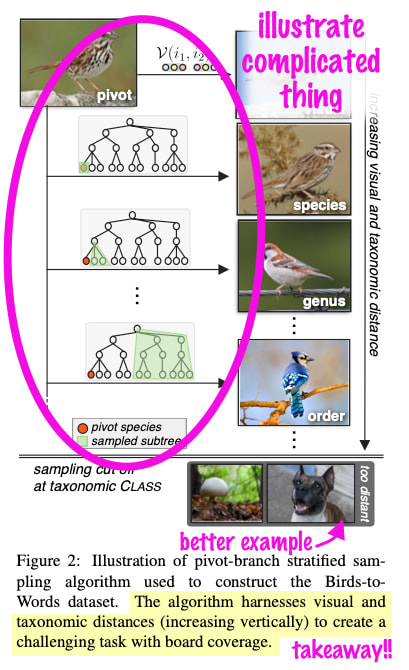
Still, the clarity just wasn’t there. Figure 2 was supposed to help, but it didn’t. In the revision, I added some graphics, which helps quickly get the idea across.
Top: Left: Rejected Figure 2. Bottom: Right: Accepted Figure 2.
In the rejected version, I thought lighter gray text would be nice because there’s a design rule that you shouldn’t use pure black. But it contrasted weirdly with the paper’s body text, which has a maddeningly adjacent font and is pure black.
In the accepted version, I went with a sans-serif, black text which helped the figure feel solid and distinct. And more importantly, I used the real estate to illustrate a complicated thing with a natural visual (the pivot-branch sampling).
Go Ahead and Invent a Helpful Taxonomy
The first reviewers were confused about our dataset. Was it interesting or valuable?
I had shot myself in the foot with crappy writing that situated the contribution as incremental and marginally different (see abstract and intro sections above), but there’s no harm in over-correcting, right?
We first introduced this table—new in the revision—just to contrast example sentences from the most related datasets. This alone would have been great because examples are densely impactful brain magic.
But one of the biggest brain blasts I had was realizing that I could simply invent helpful axes (circled) along which to compare the datasets.
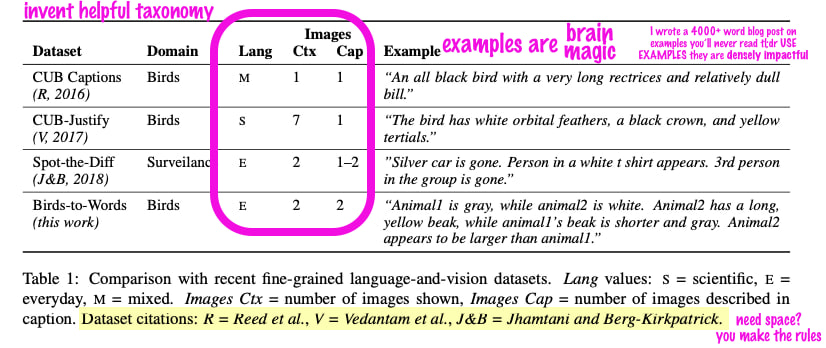
Dataset comparison table (new in accepted version).
Not only are examples incredibly helpful to get a flavor of things, the taxonomy I made up helps with quantitative (ish) framing.
Inventing the dataset taxonomy helped free up my brain from imaginary rules. For example, the data citations wouldn’t fit in the table without destroying the alignment. What to do? Well, I simply moved them to the caption. Can you do that? Nobody complained.
Sprinkle in Graphics for Variety
A chart helps break up the visual rhythm of a paper. Plus, it can demonstrate a property that’s otherwise hard to grasp. (Here: that we have longer text than other datasets.)
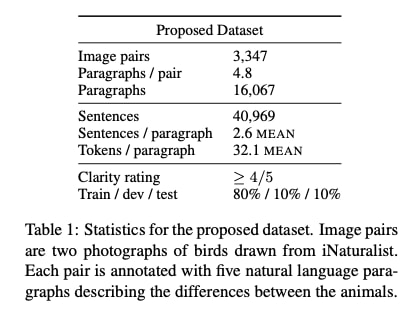
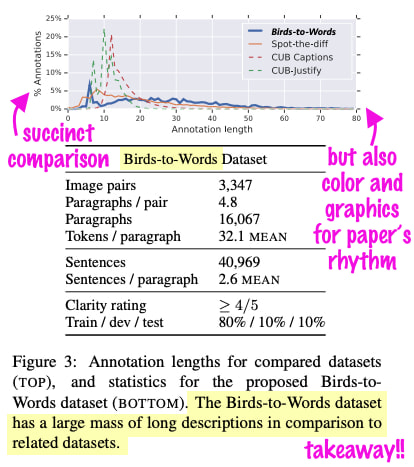
Top: Left: Rejected dataset stats. Bottom: Right: Accepted dataset stats.
Don’t forget, we’re still putting the takeaway message at the end of the caption.
Make Your Contribution Shine
I had done a bad job highlighting how interesting the model was. In the revision, I not only drew out the components we ablated (yellow, red), but I used color to link them to the results table later in the paper. As a bonus, we now have warm colors (yellow, red) for the encoder and cool colors (blue, green) for the decoder.
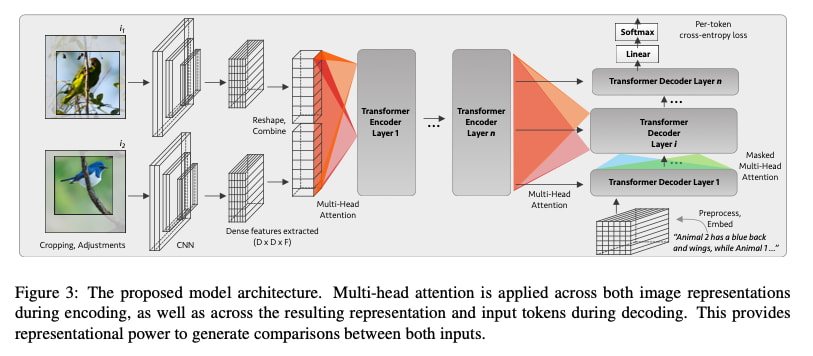
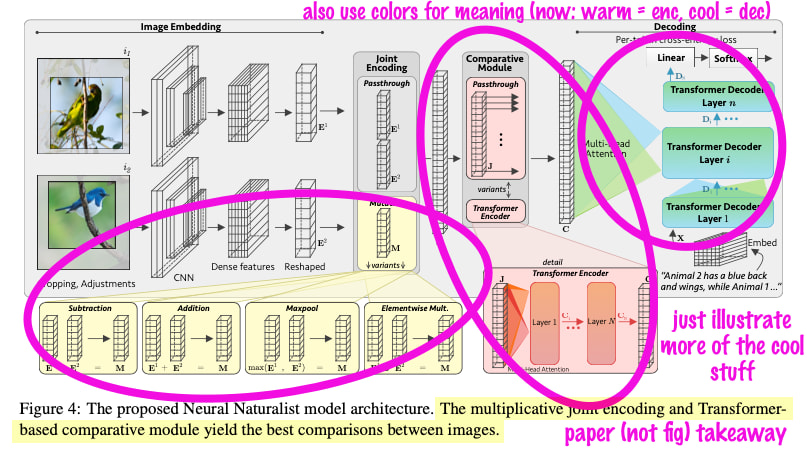
Top: Rejected model figure. Bottom: Accepted model figure.
I help the reader out by telling them in advance what configuration of the model works best as the takeaway sentence of the caption. This is another good trick to remember: don’t withhold information to surprise readers. They like to know early and often. I am guilty of this and it’s still a hard habit to break.
Delete Stuff Around the 2/3 Mark
Several changes above take up more space. Where do we cut?
In an eight-page paper, pages five through seven probably contain good candidates.
Fortunately, we already had a figure with an excessive number of outputs. I’m a big fan of showing your system’s outputs, so I’d included nine scenarios (i.e., eighteen total photos and paragraphs). This is great, but trimming to six scenarios still leaves plenty. Plus it let us be pickier with which ones were included.11
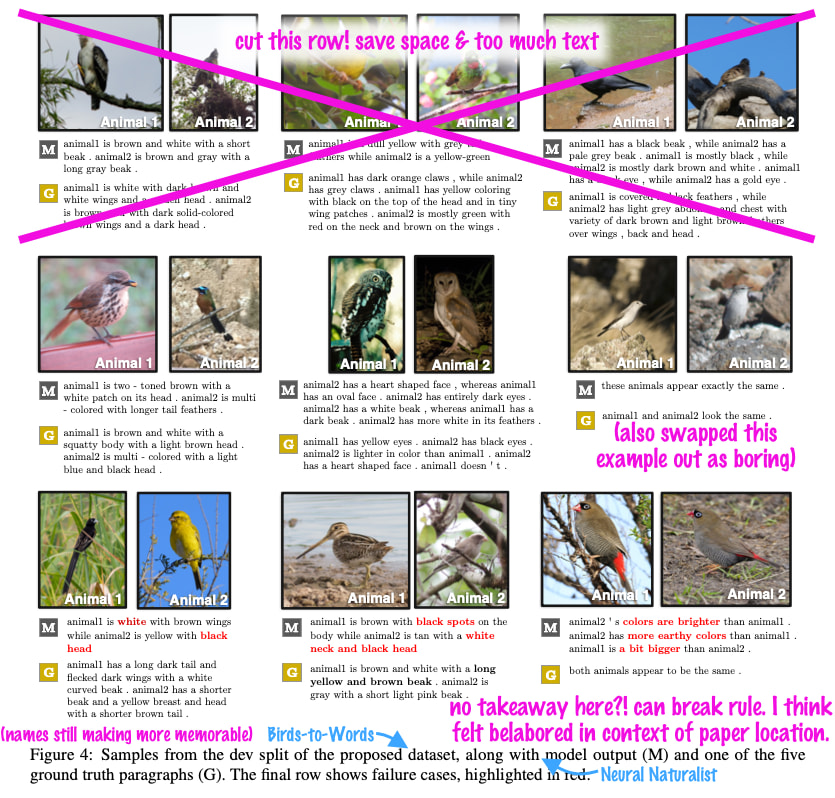
Example outputs. Top row removed in the resubmission.
Notice there’s no takeaway sentence here. Rules are guidelines. If the takeaway feels belabored and out-of-place, omit it.
Add Everything You Might Ask For
This is where the thinking in reverse part comes in at full force. Think of the most common reviewer complaints and avoid them.
The easiest reasons reviewers could give to reject you were:
- lack of baselines
- lack of ablations
- lack of human evaluation
So, add those things.
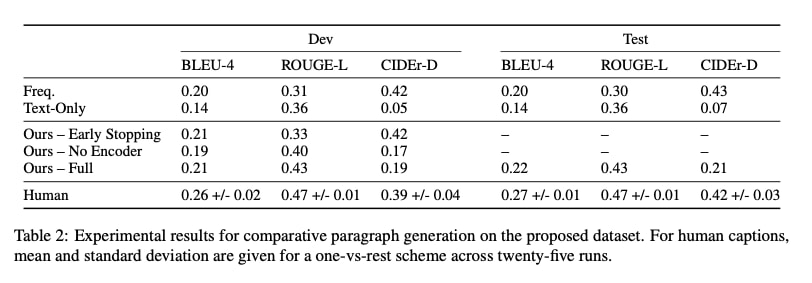
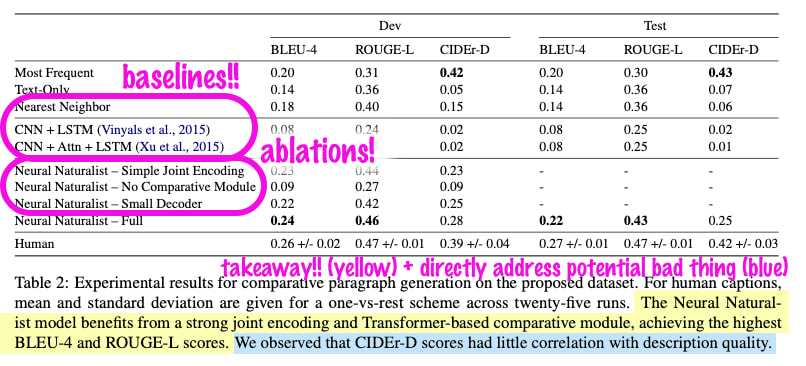
Top: Rejected results. Bottom: Accepted results.
My favorite part is in the takeaway (yellow), we highlight and explain a weak-looking result (blue).
The baselines and ablations took relatively little work to run and probably improved the actual science contribution (more on that soon).
We already had a dream human evaluation, which is getting people to use the captions for an objective task (i.e., can you pick which animal is which?) rather than scoring them on subjective quality metrics (e.g., how fluent is the text 1–5?). No changes there.
Go a Little Overboard
Somehow we made space for an enormous table of ablations. Running lots of ablations12 is a luxury of having a small dataset.13
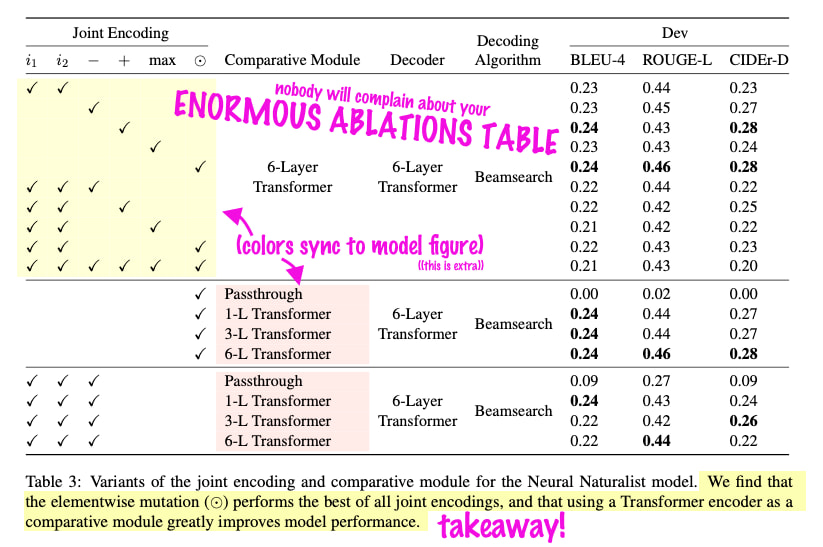
Ablations table (new in the revision.)
You don’t have to go overboard in the ablations. Just maybe somewhere. In future papers, I went overboard in the appendix. Including lots of information (tastefully) shows that you really care and that you did a lot of work.
The Three-Sentence Conclusion
To revise the conclusion, distill the advice from the abstract and introduction. Also, remove all the framing. We’re left with a concrete, three-sentence highlight reel.
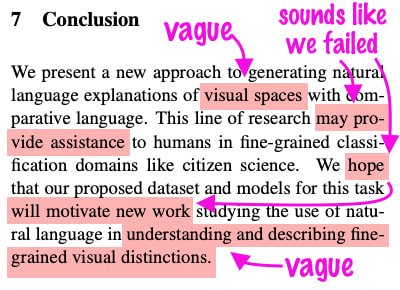
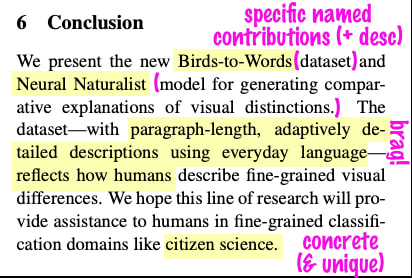
Top: Left: Rejected conclusion. Bottom: Right: Accepted conclusion.
Normal writing advice would say something like this: Write your conclusion using three sentences:
- What do we do?
- Why is it great?
- Why does it matter?
But check out the rejected conclusion. It (roughly) follows this structure too! The real improvement in the revision is specificity.
The Science Thing Was Improved
After making these mostly aesthetic revisions and seeing the paper accepted with dramatically higher scores, the initial thrill inevitably wore off. I grew more cynical of science. While we had improved the framing of our work, I thought, the core science thing we achieved was the same—the dataset, the model, the human evaluation, and the overall task framing itself (which is the hardest part).
Now, I believe such seemingly-surface dressings actually strengthen the underlying science thing. Let me try to convince you why.
The primary objects of modern science are research papers. Research papers are acts of communication. Few people will actually download and use our dataset. Nobody will download and use our model—they can’t, it’s locked inside Google’s proprietary stack.14 But anyone who reads our paper could learn from what we did, and all the revisions to clarity and completeness improve how much they can learn per minute spent reading. And it’s not just a pace thing, there’s a threshold of clarity that divides learned nothing from got at least one new idea.
Science is communication.15 Dramatically improving communication improves the science.
Aside: The idea of ‘making a reader want to read more’ has an unexpected link to game development. You’d think there’d be no need for such antics in a scientific research paper, yet dull obtuse prose can scare off readers, obscure the message, and deflate the contribution’s impact. Getting readers to the end—at least of page 1—is a necessary goal to optimize for. Just so with game design and ‘hooks.’ Games employ several hooks to draw players along, which might quickly be lumped into: stories build tension, todo lists beg completion, and ‘number goes up.’ Omitting these entirely robs a game of ‘stickiness,’16 leading players to grow bored and stop early. In both papers and games, we must learn to make the object sufficiently engaging so that its consumer is driven to experience the bulk of our creation.
Appendix: Full PDFs
If you’d like to check out the original, raw PDFs that we submitted, they’re available for download here. The appendices (i.e., supplementary material) are nearly identical, but I’ve also included them for completeness.
Footnotes
Review scores spanned 1–5, with 5 = “consider for best paper,” and 3 = “weak accept.” The conferences were both of equal prestige (ACL and EMNLP respectively). Also, I use “I” for simplicity, but as always, this was work done with coauthors. ↩︎
Please do good work before optimizing your paper. I’m assuming in this post that you are doing quality research, and you want it to be published to further your career. You need to get past the gatekeeping reviewers. In other words, please use this process for good and not evil. But if you do use it for evil, it’s not a big deal either. Another ignored paper will be in a conference instead of just on Arxiv. ↩︎
I added “Figure 1,” but I stand by my revision. Thanks to Kenneth Marino and David Freire for finding the source of this quote. Jitendra’s talk is great—I watched it after writing the first draft of this and couldn’t believe how much overlap there was! (I never saw his talk, but someone who went told me about that quote.) Also, aside, don’t get hung up on senior advisors thinking they actually spend as much time working on the title as you do writing the rest of the paper. Yes the title is really, really important, but they don’t. Let them think they do. ↩︎
Its bird’s-eye (ahem) view. ↩︎
It’s OK if so, but it’s a different vibe, and probably harder to pull off—more in line with an opinion piece. ↩︎
Having now watched Jitendra’s talk (linked in the quote above), he articulates this brilliantly: the title should “evoke the key concept of the paper” and “be memorable.” But my favorite part: “think about it in terms of the conditional entropy;” your title should only be able to describe your paper and no one else’s (at a conference). ↩︎
I must point out again that your point will be so obvious to you because it’s why you spent hours making the figure, but a new reader may barely spend enough time looking at your thing to understand what the axes are. Help them out. Even stuff like “higher is better” is helpful unless completely trivial. ↩︎
E.g., check this one from Scarecrow (Dou & me et al., 2022)
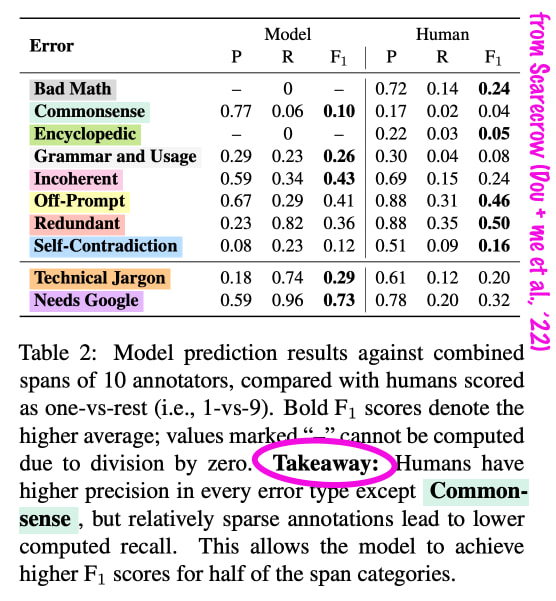 This is a great example because the table’s interpretation is so complicated that even I (who wrote it) had forgotten what the takeaway was supposed to be a few years later, and would not have easily rediscovered it. ↩︎
Why does do we feel betrayed? I think because there’s an implicit promise that if you’re talking about something, your paper is going to address it. So if you’re outlining broad swaths of a field, even if in an attempt to just situate your work, it can come across as implying that you’re contributing to this whole grand situation. There’s a delicate balance to strike. Some context in the intro or related work is often necessary. ↩︎
As with everything, strike a balance. Engaging writing and very unique hooks—e.g., having the phrases ‘citizen science’ and ‘biodiversity’ in an NLP paper—must come as sprinkles on top of a solid contribution that appropriately satisfies the community’s expectations. ↩︎
I think the other place we saved the most space was in the qualitative analysis. I could probably write eight pages of only qualitative model analysis, so I always end up with too much in the first draft. ↩︎
The blind bolding of higher numbers without statistical significance tests is truly heinous, I know. I hope somebody has standardized tests that you run on output metrics by now to do this. (Just kidding, I’m sure they haven’t.) ↩︎
Also, being somewhere like Google. DeepMind wasn’t busy with the TPUs that week so we added a bunch of flags and let them go brrr. But the dataset is so small that by the time Google’s ancient behemoth cluster system had made a dashboard where I could see how the run was going, it had already ran over the whole training dataset (potentially many times, memory is failing me). ↩︎
Even if it were open source, let me tell you from first-hand experience that getting someone’s research code to run is no small feat, especially under even marginally different conditions. ↩︎
See Science 1 vs Science 2 in this essay series for more of this argument. ↩︎
On the other hand, leaning too hard into them and using darker patterns (like gambling mechanics) can cause addiction (and bankruptcy). ↩︎
