May 1, 2025
Weatherspread
Remember the weather. Check the spread.
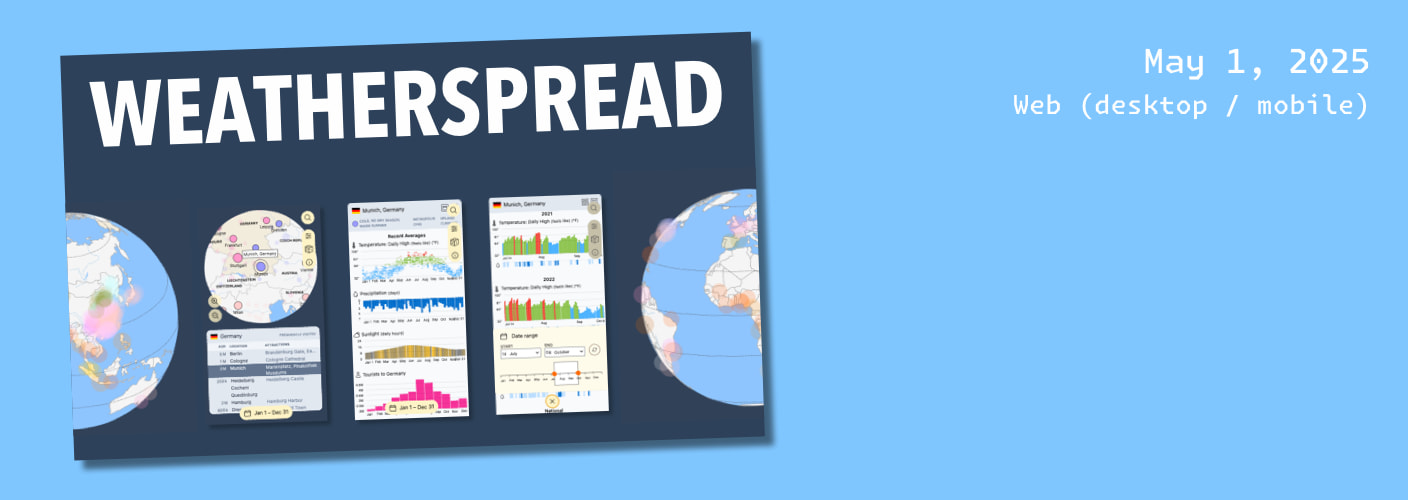
Weatherspread is a web app that helps you plan travel and events that are far enough away that there’s no weather forecast. Weatherspread visualizes recent historical weather and tourism data in a customizable interface. Collaboration with Shelby Wilson and Tristan Huber.
